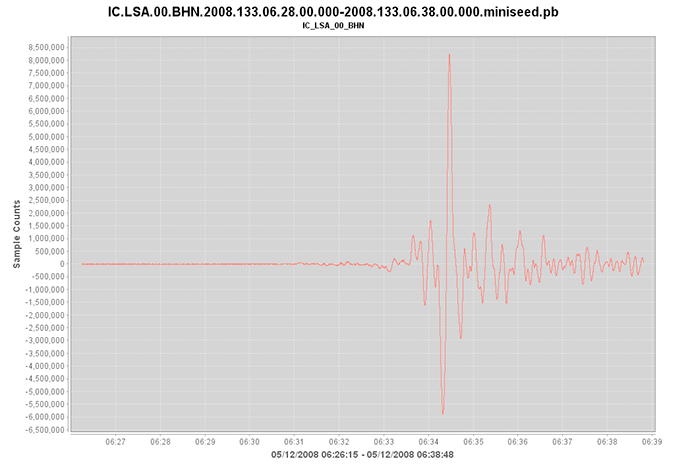
IRIS DMC Waveform Plotting Workflow
For the IDEAL Waveform Plotting Workflow project, our goals are to produce a workflow with a SOAP interface that allows users to discover events and gather waveforms from the stations. The first draft of the middleware is finished and the client software is in progress (a descoped demo version exists). The middleware is scheduling structure that we’ve built to keep track of requests, provide feedback on the status of the requests, and scale the request processors to any number
of consumers.
A component diagram of the architecture can be seen below.

This workflow will extract seismograms from the DMC Mass Storage System based upon user specified parameters, apply a gain correction, resample the data if requested, and display the seismogram as an image file. As the suite of web services is enriched at the DMC other processes can be applied such as rotating the traces, applying filters and the output of simple ascii or binary analysis formats. This approach will greatly simplify the current Breqfast, rdseed, SAC sequence that many users now follow.

by Nichole King (IRIS Data Management Center)


