IRIS Web Statistics for the M9.0 Tohoku, Japan earthquake
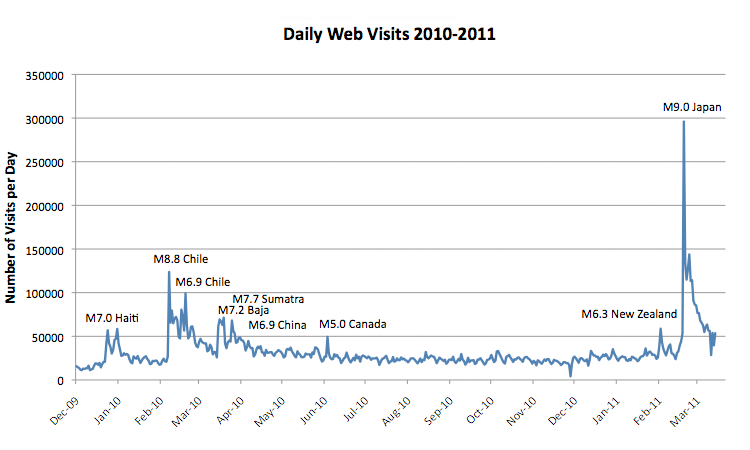
On March 11, 2011, the M9.0 Tohoku, Japan earthquake generated a lot of public interest – leading to a 300% increase in visits to the IRIS website.
IRIS website sets new record
In March 2011, there were 17 million pageviews from 2.3 million visits to the IRIS website. Seismic Monitor, our most popular webpage, set a record with 6.5 million pageviews.


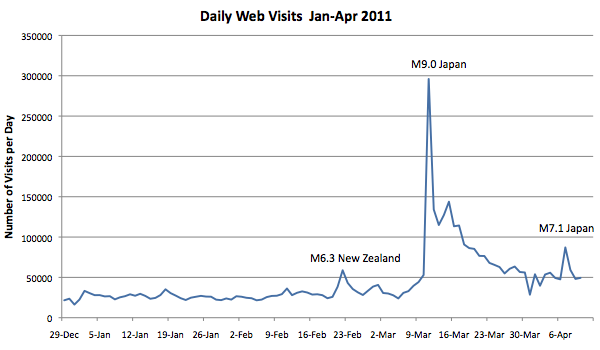
IRIS web traffic peaked at 296,000 visits on March 11th, 2011 – the day of the Japan event.

Three weeks after the Japan event, the baseline increased form 25,000 to 50,000 visits per day – twice the average for the year. Note that it can take two to three weeks for web traffic to return to a baseline level following a major event.
Comparison of IRIS Web Visits for Seismic Events in 2010-2011

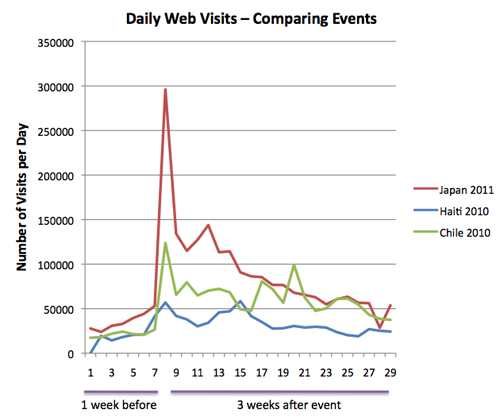
The Japan event had over twice as many web visits, on the first day, as the Chile event. The Haiti event displays two peaks, of 60,000 visits each, from M7.0 and M5.9 events.
Education and Public Outreach

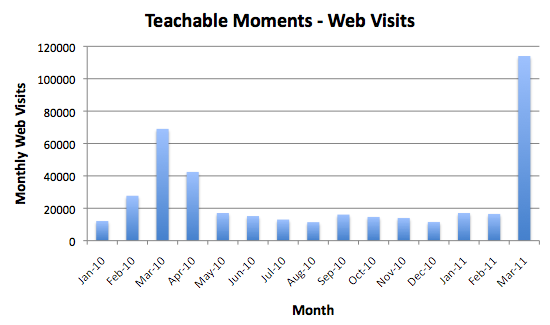
In March 2011, there were over 110,000 hits to the Teachable Moments webpage featuring information about the Tohoku, Japan earthquake. The peaks in February and March 2010 correspond to the M8.8 Chile earthquake.
by Tim Knight (IRIS Data Management Center)


