TA network "final" datasets at the IRIS Data Management Center
Background
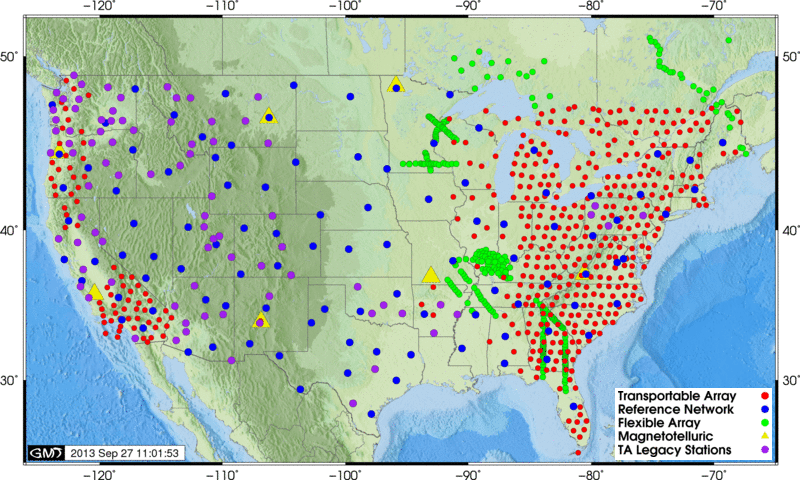
The Transportable Array (TA) seismic network, part of the EarthScope USArray program, had its start on the west coast of the United States in 2004 and has spent the last 10 years migrating across the contiguous United States, with an average site occupied for nearly 2 years. It is currently located along the eastern United States and southeastern Canada (see Figure 1) and the last site installations will be finished by the end of 2013. As of September 2013, 1662 TA network stations have been installed; 443 are currently operating, and 1219 have finished their life-cycle and have been removed or adopted by other networks. Stations that have been transitioned to other organizations are listed in the _US-TA-ADOPTED virtual network.

The Array Network Facility (ANF), located at the University of California, San Diego, in an effort to create the most complete data set possible, is compiling final data sets for each TA station that are the union of near real time telemetered data and data recorded on local disk at the site, referred to as Baler data. This final data set is then sent to the IRIS DMC where it is archived with a Q quality code. The near real time data that had originally been sent to the DMC retains an R quality code in the archive, and a data request for best data will merge the data copies, with Q being the preferred quality code. When the USArray project started, retrieval of the Baler data required a site visit, usually when the station was decommissioned or adopted by a regional network. With the addition of Quanterra Baler44 Packet Balers beginning in 2010, staff at the ANF can now access baler data remotely. Currently, Baler data is retrieved and delivered to the IRIS DMC on a weekly basis for each operating station. It is usually available from the IRIS archive within 2 weeks of arrival, although data or metadata issues can sometimes cause delays.
“TA Final” Data Holdings at the DMC
Currently, the IRIS DMC archive of the TA network contains 15.6 TB of R quality code data and 14.4 TB of Q quality code data. Figure 2 shows the data holdings by the year in which the data was recorded and by the year the data was archived for each quality code. Early increases in data holdings are due to the rollout of the array, as the number of stations increased. In 2011, infrasound sensors started to be added to TA stations, further enlarging the amount of data arriving at the DMC. As should be expected, the archive dates for R data match its data holdings time stamps, indicating that there is no delay. The first delivery of Q data began in late 2009, but the majority of our current holdings have been archived this year (7.8 TB was added in 2013 so far). This is an ongoing project and not every TA station has Q quality data available yet.

R and Q quality data, through September 2013. The data holdings indicate the year time-stamped on the data, while the archived dates are the year the data was written to the DMC archive.
Quality of “TA Final” Data
The purpose of assembling the final data sets is to increase the quality and usability of USArray TA data by making it as continuous as possible. The following analysis looks at the improvements realized by the addition of Q data for 958 TA stations for which the IRIS DMC has a complete final dataset, which is defined by three metrics:
- that the station has been closed;
- the ANF has retrieved all the baler data available;
- and the DMC has confirmed that all data have been archived.
These 958 stations have installation dates that range from July 2004 to May 2011. Looking at data availability in terms of completeness, the average return for these stations is 97.4% during the time period between the station start and end dates as defined in the metadata. As telemetry improvements were made over the life of the array, this percentage increased to 99.2% compared to 96.2% for stations installed prior to 2009. The addition of Q data brings the average percent completeness per station to 99.5% (Figure 3).

final data sets.
Another way to look at data availability is the number of hours of data added to each station data set, not available as R data (Figure 4).

final data sets, for a single seismic channel.
This follows the same pattern as the percent completeness metric, with earlier stations having the most to gain from the addition of Q data. The average number of hours gained for a single seismic channel per station is 452 (~19 days); the median is 203 hours (~8.5 days). An additional measure of quality is the continuity of the data record, where fewer gaps improve the usability of the data. With Q data, 53,382 station-days that previously had at least one gap now have no gaps, and 11,083 station-days that had no data now have at least some data (Figure 5). The quality of the real time TA network data is very good, and the addition of the on-site disk data in the form of “final” data sets is an effort that makes it even better.

final data sets, for LHZ channels. The total number of station-days is 663765.
by Gillian Sharer and Rick Benson (IRIS Data Management Center)


