Mustang PDF/PSD Noise Analysis System
Legacy of QUACK
At the end of December 2015, the QUACK seismic data quality system was fully retired. QUACK contained a popular system for calculating and displaying Power Spectral Density (PSD) and Power Density Function (PDF) information calculated from data flowing into the realtime seismic waveform data collection system known as BUD. The QUACK PSD/PDF system was developed with the help of Dan McNamara and Richard Boaz (see McNamara & Boaz). Experience and knowledge gained in building the QUACK system was used to develop the a PSD/PDF system within the MUSTANG framework.
Overall Design
A program written in the R programming language, adapted from the McNamara/Boaz algorithm, running on multiple Linux computers is responsible for making raw, uncorrected PSD estimates from waveform data retrieved from the http://service/fdsnws/dataselect/1 web service. The output from the R code is written into XML formatted documents which are uploaded to a central internal webservice which in turn writes the values into a Postgres database. A suite of programs written in the Java programming language manage the storage of this information and the compilation of the PSDs into PDFs. Three web services allow users to access to the stored PSD/PDF information.
Instrument Response Correction and Re-Correction
In general, the workflow for calculating PSDs involves (1) reading unit-less time series waveform data into a buffer, (2) time windowing the buffer into segments, (3) transforming to the frequency domain, (4) stacking power amplitudes and finally (5) converting to physical units by the known instrument response. The results of these calculations are then saved. PDFs are then generated by stacking PSDs into histograms. A practical problem with the 1-5 workflow lies with step 5 — namely, that the notion of the instrument response often changes over the course of time. At the IRIS DMC we often receive corrections to metadata long after receiving waveform data. A limitation with QUACK was that when metadata was updated it did not trigger the recalculation of PSDs and PDFs*. With the MUSTANG system, this deficiency has been solved. The raw values from step 4 as well as corrected values in step 5 along with the response information used to make the corrections are stored. On a weekly basis the stored response information is compared with current response information in the IRIS DMC holdings. Any detected changes in response are then applied to the raw values (4) to regenerate the corrected ones (5). This skips computationally expensive steps 1-4. This is a relatively quick operation takes less than half a day to sweep and update the entire holdings in the MUSTANG system. The process of updating PSDs in turn triggers a cascade of updating of PDFs.
The response information used by the MUSTANG PSD system originates from the http://service.iris.edu/irisws/evalresp/1 web service.
PSD Data Storage
Internally, the QUACK system used ascii text files to store PSD/PDF information. There were two files per channel-day; one for the PSD information and one for the PDF information. This resulted in a large file system containing many millions of files. In the MUSTANG system PSD/PDF information is stored in a set of Postgres database tables. The PSD/PDF information is stored using a simple binary format and is saved in database binary data fields rather than text files. This has proven to be a very efficient and fast means of storing and retrieving the PSD/PDF information.
Each individual PSD is comprised of roughly 90 frequency power pairs and represents one hour of data. PSDs are calculated at hour, and half-hour, overlapping intervals. Typically there are 47 PSDs per channel per day. In the MUSTANG system, one database row is used per channel-day to store PSD information.
Tiered PDF Data Storage for Rapid Data Retrieval
PDFs can be thought of as two dimensional histograms where the dimensions are frequency and power that is chopped into a grid of hit-buckets. A hit occurs when a PSD curve crosses a PDF bucket. Multiple PSDs are stacked into a single PDF. In the MUSTANG system each PDF is stored as one row in a table. While PSDs are always stored at the channel-day level, for PDFs a tiered system of time intervals is used. This enables the rapid retrieval of PDFs for arbitrary time ranges.
PDF data is stored in 5 date range tiers:
- Day
- Week
- Month
- Year
- All time
When retrieving PDFs for arbitrary time ranges, calendar logic is used to calculate the minimum number of rows need to tile the time range. For example, to retrieve the time interval 2013-11-29 to 2015-02-07 just 6 rows need be retrieved:
- Days of 2013-11-29 and 2013-11-30
- Week of 2015-02-01
- Months of December 2013, January 2015
- Year 2014
Note that this represents 435 days of data. Also worth noting is that retrieving the all-time PDF for a channel requires retrieving just one row. This efficient storage scheme makes it possible to quickly combine PDFs from a large set of channels for large time-ranges.
Web Services
Currently, three web services are available for retrieving PSD and PDF information from the MUSTANG system:
- PSD
- Noise Mode Timeseries
The web services offer output formats of plot, xml and text. Several plot customization options are available including image size, plot titles, font sizes and the displayed frequency and power ranges.
PSD Web Service
http://service.iris.edu/mustang/noise-psd/1
The PSD web service is capable of retrieving PSD data from individual as well as multiple channels. It has an option to return the uncorrected PSDs (see step 4 above). This can be useful when trying to understand the effects of response information.
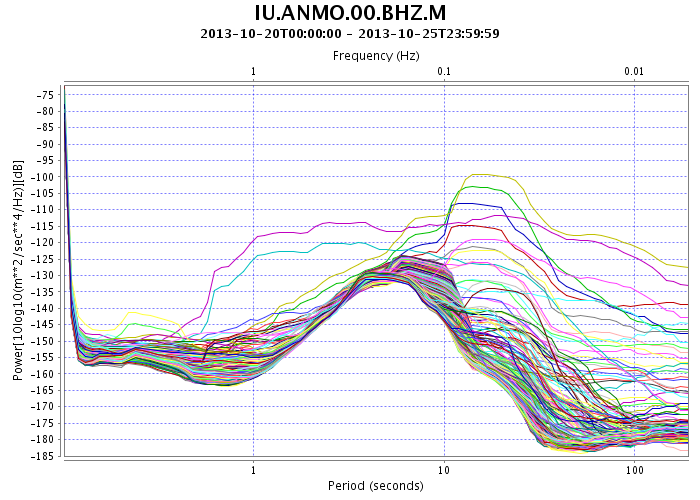
The following plot shows six days of PSD data. Each curve is a PSD representing one hour of waveform data. The PSD webservice is only practical for displaying data for short periods of time (less than a month).

PDF Web Service
http://service.iris.edu/mustang/noise-pdf/1
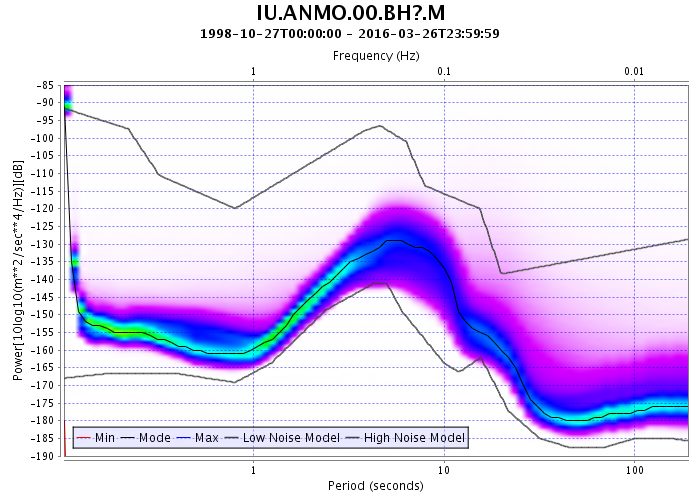
The PDF web service is capable of retrieving PDF data from individual as well as multiple channels. Using time intervals that correspond to months, years or all-time can increase the response time of the service since fewer rows need to be retrieved from the database.
The following plot it a compilation of all time for network: IU, station: ANMO, location: 00, channels: BH1, BH2, BHZ

Noise Mode Timeseries
http://service.iris.edu/mustang/noise-mode-timeseries/1/
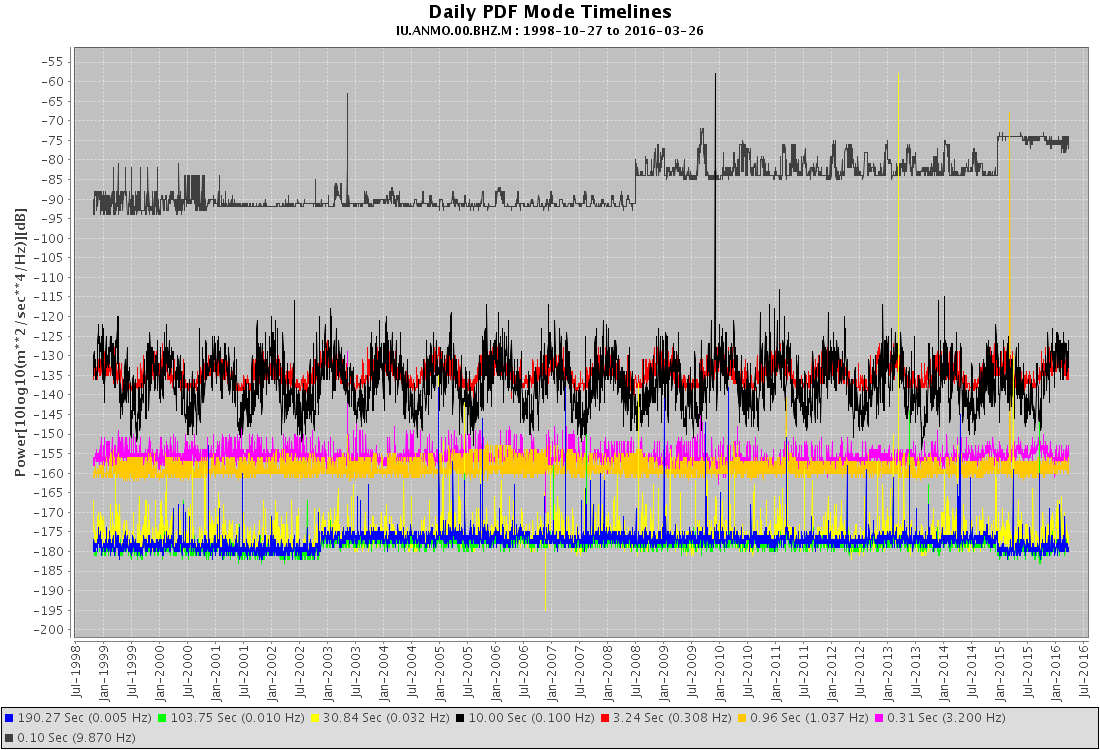
The Noise Mode Timeseries web service outputs the daily mode power values for different frequencies as a function of time for a given network, station, location and channel. By default eight frequencies are automatically chosen. This service makes it possible to view time variations of the noise characteristics of channels. In the plot shown here, an annual cycle at the 10 second and 3.24 second periods is clearly visible.

Future Work
The QUACK system featured a web application which allowed for the browsing of all PDFs for a given network and time ranges. In the coming months we will be developing similar features for the MUSTANG system. This will likely include an availability web service which will return what measurements are available for download. Currently, there is no such mechanism externally available.
by Bruce Weertman (IRIS DMC)


