WILBER - Web Interface to Lookup Big Events for Retrieval
WILBER was designed (back in 1997) to provide users with a means of viewing SPYDER® and FARM data before requesting the data. (Both SPYDER® and FARM are covered in this issue.) Within weeks of its release, WILBER became one of the most widely used data access tools at the DMC. The WILBER system has also been installed on the ORFEUS website and similar models are under development at GEOFON, GEOSCOPE and Scripps.
WILBER was originally designed with the professional seismologist in mind. The community requested a tool by which data could be previewed before being requested. This option of “browsing” the data saves the user time in weeding out seismograms that are not appropriate for their needs. Shortly after WILBER was first released, IRIS started its Education & Outreach program and a new use for WILBER was born. It became a way for educators and students to view near-real-time data (via SPYDER®) and to download data in formats that are compatible with educational software.

The maps, event listings, station lists, and seismogram plots are all automatically generated within minutes of data retrieval from SPYDER® and generation of FARM volumes. When there is both SPYDER® and FARM data available for a given event, the event list (Fig. 1) displays both options and color codes those files that are related to one another (i.e. two black or red files together are the same event). This overlap gives the user the choice of quality controlled data or “raw” data when available. Some SPYDER® events don’t meet FARM criteria but the data remains available.

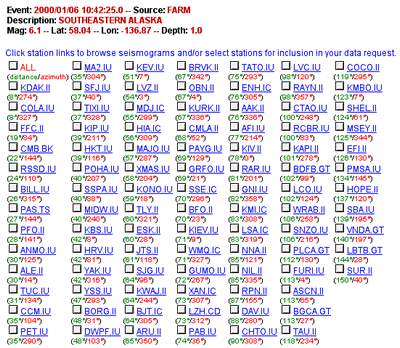
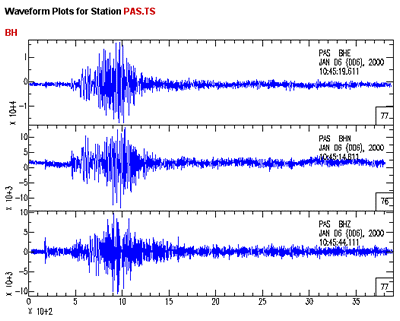
The extensive station listings aid users in browsing and requesting data (Fig. 2). Clicking on the station name brings up any available seismograms for viewing (Fig. 3 below). The station list includes the distance and azimuth from the event and the list can be sorted by distance or alphabetically.

Output options are numerous and designed to meet the needs of our multi-discipline audience. Requests rarely take more than a few minutes to fulfill — 60 seconds is the norm — making this request method the quickest the DMC has to offer.
For more information about WILBER, please view the extensive help documentation.
by Deborah Barnes (IRIS Data Management Center)


